-


Follow Us


The Toronto Blue Jays starting pitchers had a very successful 2023 season. They generated the third-lowest ERA, fifth-most innings and sixth-best fWAR. Also, performance and relative health limited the number of starters used by Toronto to eight, tied for MLB’s fewest. Let’s examine how Toronto’s starter depth performed in 2023 and how it looks heading into the 2024 season.
Spoiler Alert
Toronto’s starter depth performed well in 2023 and is projected to do so in 2024.
There is no better way to commence an analysis than using a chart—even better, two charts!
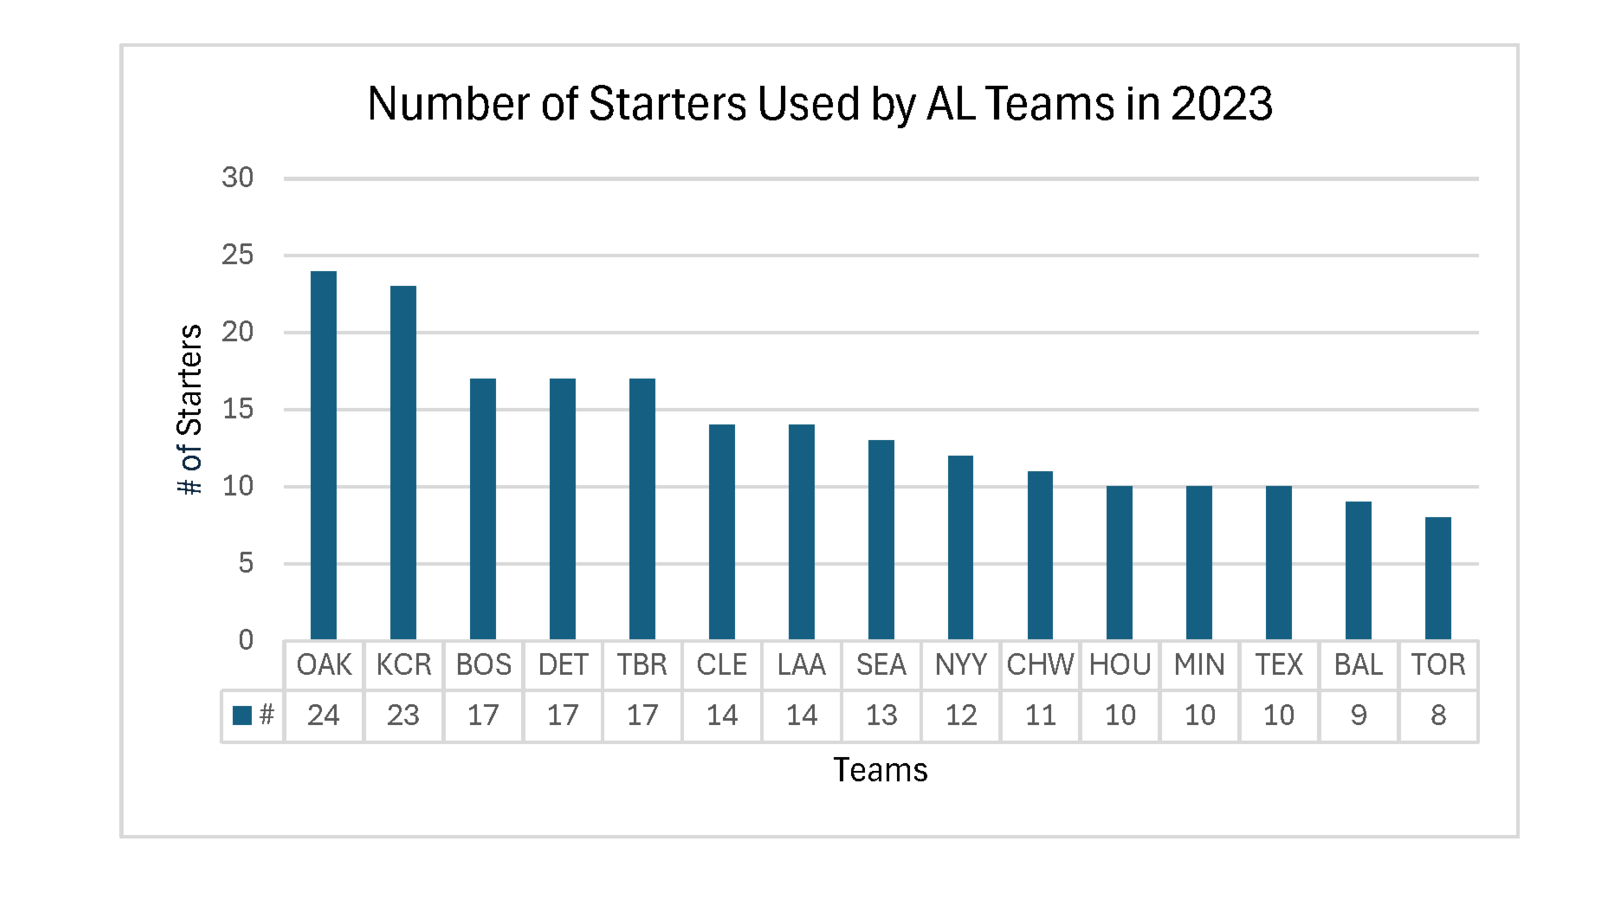
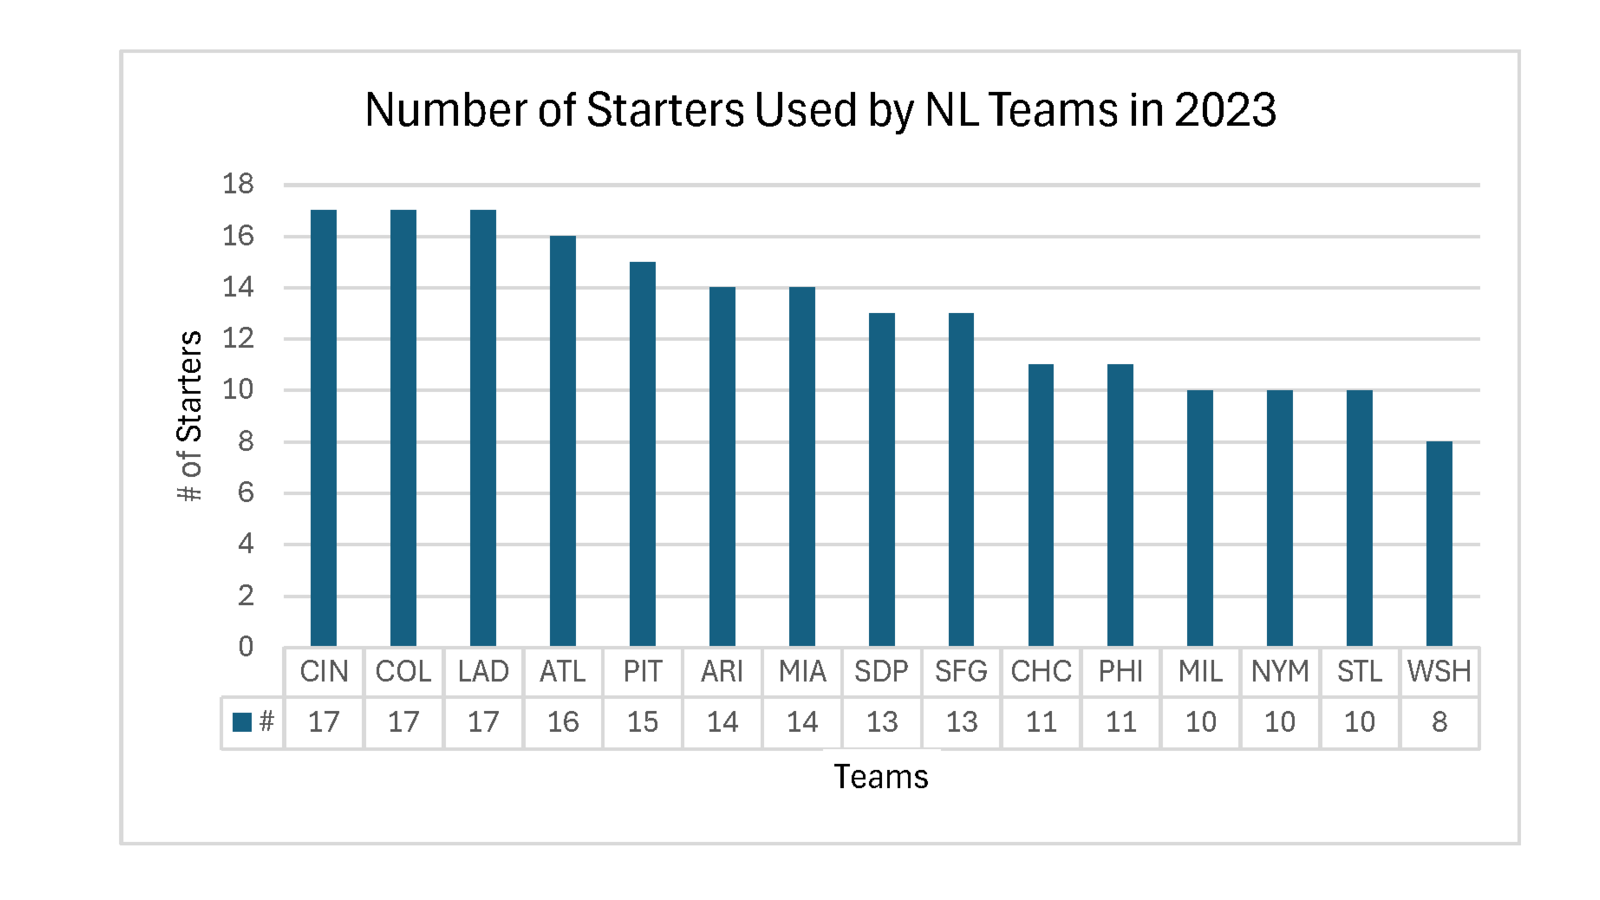
I present the number of starters utilized by MLB teams last season for each league. The reader will see that Toronto used eight different starters, tied with Washington for the fewest in 2023. Oakland was top of the charts at 24.
Recently, I read articles or heard comments regarding the average number of starters used by teams was 13 in 2023. Although technically correct (the 30 MLB teams used 383 starters), the figure lacks context. Onto the tables!
Distribution of Starts
Table 1 shows the distribution of starts as a percentage of all starts. I compiled the data by ranking the number of starts made by each pitcher from most to least. Last season, the members of Toronto’s Top 5 by number of starts were Chris Bassitt (33), Jose Berrios (32), Yusei Kikuchi (32), Kevin Gausman (31) and Alek Manoah (19). These pitchers accounted for 91% of Toronto’s starts, and the other three who started contributed the other 9%.
Let’s reconsider the noted 13 average starters per team. Suppose a team’s #5 starter is better than its #6 starter, their #6 starter is better than its #7 starter, and so on. By the time you reach the #13 starter, a team could be handing the ball to a less-than-cromulent MLB starting pitcher.
However, Table 1 illustrates that a team’s pitchers’ starts are not evenly distributed. In 2023, on average, nine pitchers made 94% of a team’s starts, and the other four accounted for 6%. Furthermore, of the 20% of starts provided by pitchers in the Next 4 category, 13% were made by pitchers with the sixth and seventh-most number of starts. In other words, on average, 87% of a team’s starts were made by a team’s Top 7 starters.
Additionally, one should consider the starts made by an Opener. I could not find reliable Opener data, but I used the number of pitchers with average outings of three or fewer innings per start as a proxy. There were 91 such pitchers, which translates into three Openers per team. Therefore, of the 13 average starters per team, 3 are relievers in the role of an Opener.
Hence, given that the number of starts is skewed towards the Top 9 by starts (94%), which may include Openers, a team’s challenge to find serviceable “traditional starters” is not as daunting as the number 13 may suggest. On the assumption that starters in the Others group are less effective than starters in the Top 9, their impact is mitigated by fewer outings (on average 6% of starts) and the use of Openers.

Earned Run Average
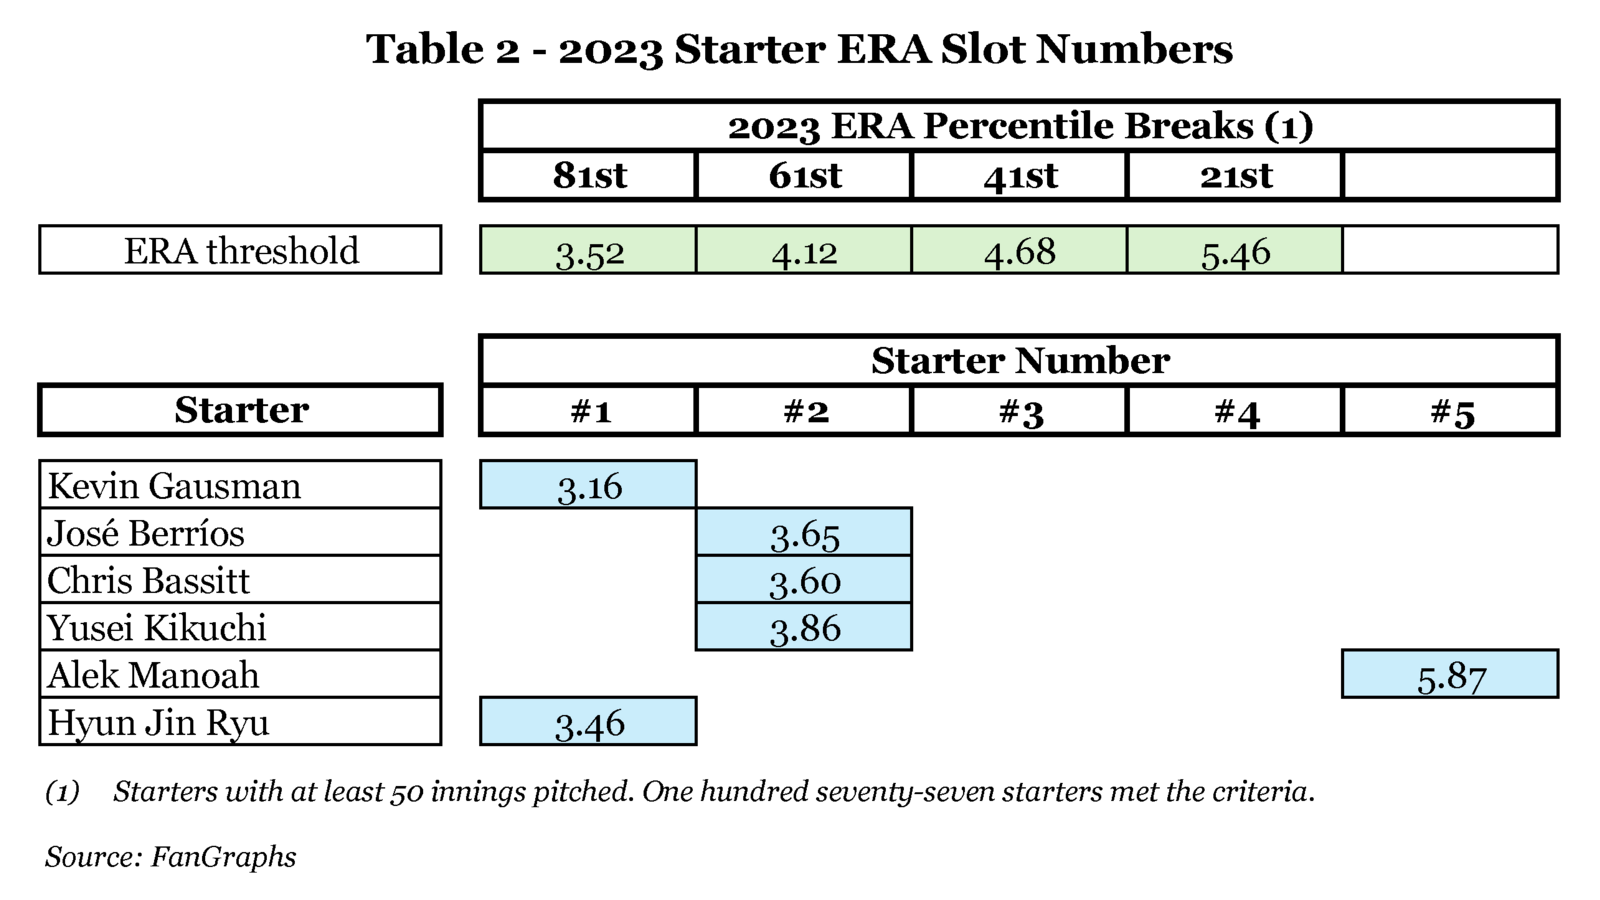
Before I review how Toronto’s starting pitching depth performed in 2023 and how it is projected to contribute in 2024, some ERA context is required. Consider Table 2.
Suppose we assign starters into the #1 to #5 slots using ERA. If a starter has an ERA equal to or lower than the 81st-percentile ERA, the pitcher is a #1. A starter with an ERA equal to or lower than the 61st percentile but higher than the 81st percentile is a #2, and so on. Table 2 summarizes the percentile breaks and how Toronto’s main starters ranked in 2023. Gausman and Hyun Jin Ryu were #1 starters, Berrios, Bassitt and Kikuchi were #2s and Manoah was a #5. These starter number slots will prove helpful when I analyze Toronto’s 2023 and 2024 starter depth.
I’d like to present Table 3. Below are some observations.
- Unsurprisingly, the average ERA of the starters with the sixth to ninth-most starts is higher than that of the Top 5. Additionally, the average ERA of the Others is the highest. Why is that? Teams likely give the most starts to their best starters first and then assign the remaining starts to lesser pitchers.
- For all 383 starters, the average ERA was 4.45.
- By the ERA metric, Toronto’s starters outperformed the average playoff team across all groups.
- If the Blue Jays’ Next 4 group were a single starter, its 4.43 ERA would be the equivalent of a #3 starter. That’s impressive.
- Even playoff teams have below-average starters when using pitchers outside the Top 5. The average playoff team’s Next 4 group posted a 4.80 ERA, the equivalent of a #4 starter.
- Therefore, one should expect depth starters to underperform the Top 5. However, what is critical is how those depth starters pitch relative to similar starters and the distribution of starts made by non-Top 5 pitchers.

2024 Projected Depth
All models are wrong, but some are useful.
George E. P. Box, British Mathematician
Many people are skeptical, if not outright dismissive, of models/projections. However, I like to use them because they are generated by third parties with no bias, in this case, vis-à-vis the Blue Jays.
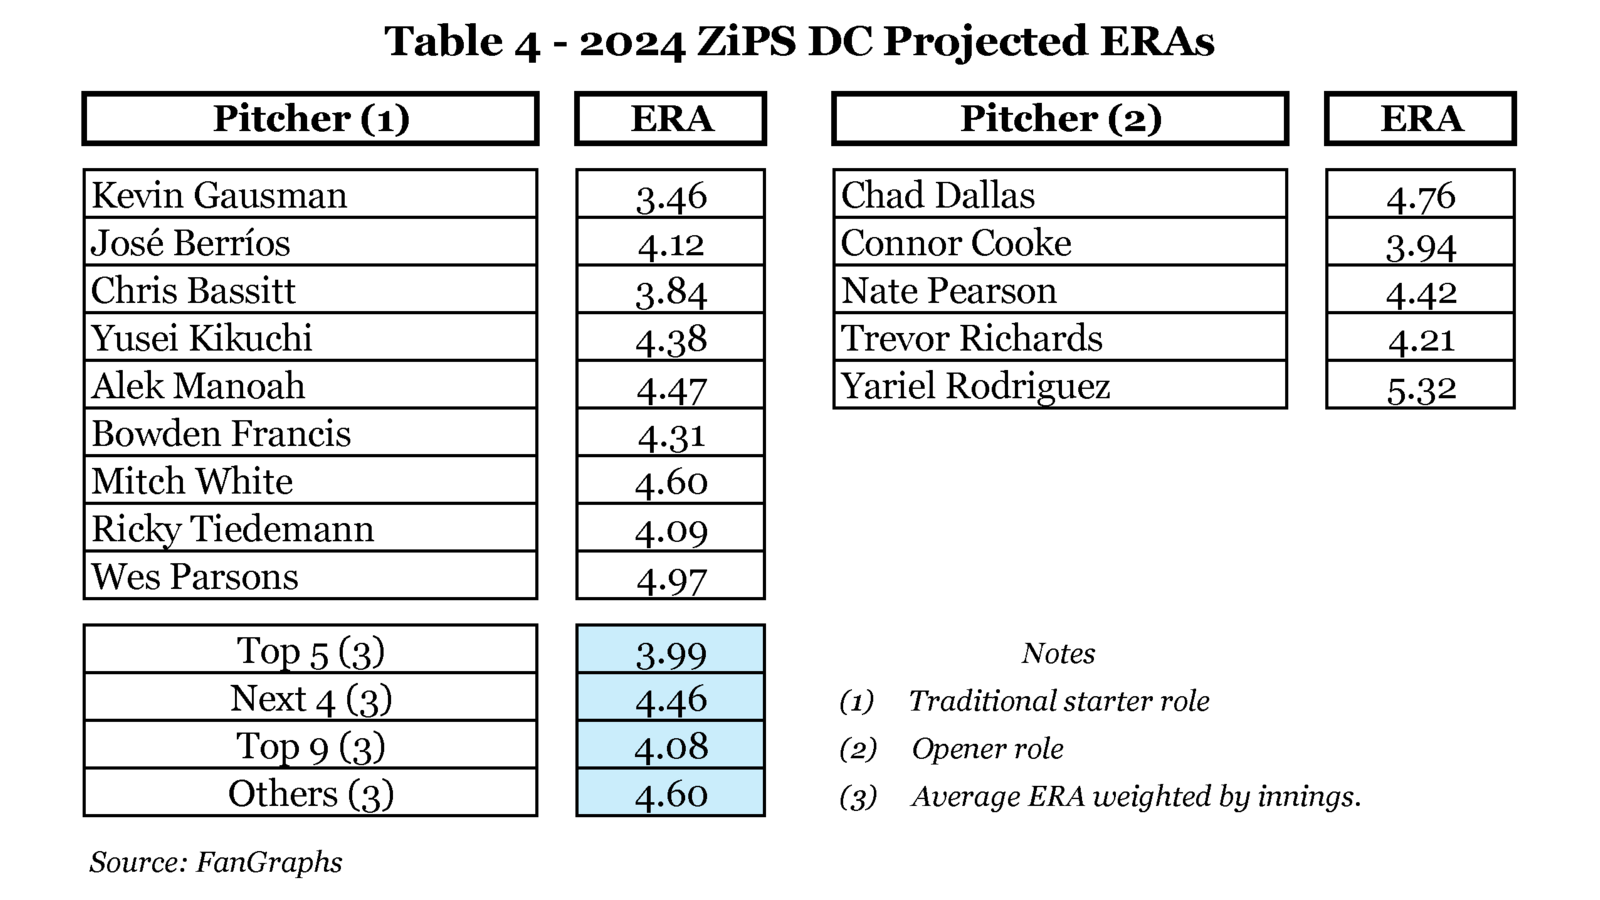
Table time again! Please consider Table 4.
The projections for the listed pitchers are courtesy of ZiPS DC, a well-known model. The table data was organized as follows:
- I sorted the pitchers by innings (most to least) and assigned them to the respective groups (Top 5, Next 4 or Others).
- For each group (Top 5, etc.), I calculated the innings-weighted ERA.
- I allocated the pitchers into two categories: Traditional Starters or Openers.
How does Toronto’s 2024 starter depth compare to 2023?
Suppose the 2023 ERA percentile breaks shown in Table 2 hold for 2024. Furthermore, if each group (Top 5, Next 4, Top 9 and Others) were an individual starter, what is the equivalent starter slot number? Please gaze upon Table 5.
Except for the Others (Toronto did not have any starters in this group in 2023), each 2024 group slots in as they did in 2023. The Top 5 and 9 are #2 starters, and the Next 4 collections are #3s. Therefore, Toronto’s starter depth performed well in 2023 and is projected to do so in 2024.

Caveats
History suggests that Toronto will need more than eight starters in 2024. Some factors to consider include the following:
- Toronto’s number of Top 5 starts was relatively high last season. Regression to the mean is a possibility.
- 2024 will be the age-30 season for Berrios, the age-33 campaign for Gausman and Kikuchi, and the age-35 season for Bassitt. There is age-related injury and performance risk for pitchers in their 30s.
- Many pitchers listed in Table 4 are relatively unproven at the MLB level. Accordingly, their projected numbers carry some small-sample-size risk.
However, given the noted caveats, Toronto’s starter depth appears to be a relative team strength.
The Last Word
Last season, no MLB team used fewer starters than the Blue Jays. Accordingly, Toronto did not have to use as many lesser-quality starting pitchers as often as most teams. Hence, the Blue Jays had good starter-depth performance.
History suggests that Toronto will have to use more starters for the upcoming campaign than in 2023. However, the ZiPS DC model estimates that Toronto will have good starter depth throughout the 2024 campaign. Hence, high-quality starter depth will be a competitive advantage for the Blue Jays in 2024, as in 2023.
More must-reads:
- Orioles stud prospect's first taste of majors doesn't last long
- Braves 2B makes speedy recovery from fractured toe
- The 'Active MLB strikeout leaders' quiz
Breaking News
Customize Your Newsletter
 +
+
Get the latest news and rumors, customized to your favorite sports and teams. Emailed daily. Always free!